The Roundtable
Welcome to the Roundtable, a forum for incisive commentary and analysis
on cases and developments in law and the legal system.
on cases and developments in law and the legal system.
 By Sneha Parthasarathy Sneha is a junior in the School of Arts and Sciences at the University of Pennsylvania majoring in Politics, Philosophy, & Economics and minoring in Healthcare Management, Biological Basis of Behavior, and Engineering Entrepreneurship.
To do so, this investigation will use Bayesian Networks and strive to answer the two following questions: Question 1a: Is the probability of being stopped, searched, and subject to police force greater for Black drivers than for white drivers? Question 1b: Is the share of Black drivers among the drivers who are stopped, searched, and subject to police force larger than their share in the total driving population? Bayesian Networks are graphical models of joint probability distribution, or the probabilities of multiple events occurring together. Bayesian Networks model the cause-effect chain between multiple events that occur one after the other. These Networks use conditional probabilities—the probability of one event given another—to determine how the probability of one event being true changes the likelihood of sequential events in the Network. Bayesian Networks use a formula called the chain rule of probability ("Bayesian"), which can be written as follows: P(a,b,c,...z) =P(a | b, c,...z) P(b | c,...z) P(c | ...z) ... P(z) Here, a, b, c… z are specific outcomes to random variables A, B… Z, or variables whose values depend on an unknown, random event. In this formula, a is the outcome of event A being true and a’ is the outcome that event A is false. P(a, b, c, … z) represents the probability of outcomes a, b,...z occurring together, or their joint probability. The comma acts as an “and,” representing when different outcomes occur together. The notation P(b | c) means the probability of event b happening given event c has already happened. Here, the events that precede event a are called its parent nodes because they are “causes” of a. The chain rule of probability essentially relates each event to its parent nodes, stating that the total probability of all the events occurring together is the product of the probabilities of each event being true given the events that precede it. When x1, x2, … xn are specific outcomes to random events, the chain rule of probability can be expressed as” P(x1, x2, … xn) = P(xi | parents Xi) 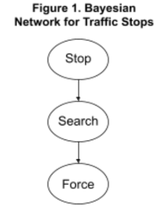 Question 1a: Is the probability of police stopping, searching, and using force on Black drivers greater than for white drivers? Answering this question requires the use of the Bayesian Network in Figure 1, which links three events: a driver being stopped, searched, and subject to force (a stop-search-force encounter). If the probability of these 3 events occurring together for Black and white drivers differs, there is clear evidence of racial bias. I found data on traffic stops in the 2015 “Contacts Between Police and the Public'' report. This report, published every few years by the Bureau of Justice Statistics, contains details about various police-civilian encounters based on responses from U.S. residents. Using “Contacts Between the Police and the Public,” I gathered demographic data on traffic stops, searches, and police use of force and their racial composition, which Table 1 shows. Table 1. Traffic Stops, Searches, and Use of Force from “Contacts Between Police and the Public” 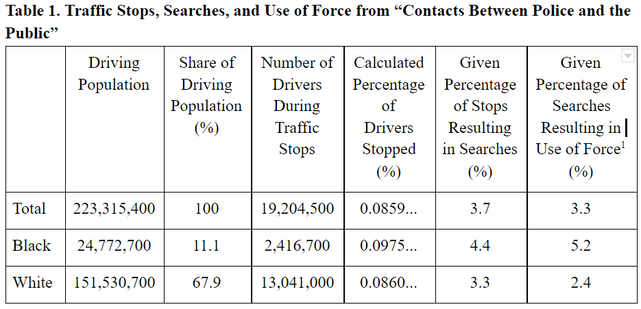 In the following section, I present my calculations. First, I calculate the probability that the police stop, search, and use force on a random driver of any race. Next, I find the same probability for Black and white drivers individually. If the probabilities differ drastically, it suggests there is some element of racial bias.
P(s, h, f) = P(f | h) P(h | s) P(s) According to the BJS report (Column 5), P(s) = 19,204,500223,315,400= 0.08599… P(h | s) is given in the data as 0.037, and P(f | h) is given in the data as 0.033. Inputting these numbers into the equation P(s, h, f) = P(f | h) P(h | s) P(s), I found: P(s, h, f) = (0.033) (0.037) (0.08599…) = 1.050025... 10-4 = 1.05 10-4 (3 sf ) About 1 in 10,000 of all drivers will face a scenario when police stop, search, and use force on them in a year.
I calculated the probability of P(s, h, f | b) as follows. Using Table 1, I found: P(s | b) = 2,416,700 24,772,700= 0.0975549... P(h | s, b) = 0.044 (given) P(f | h, s, b) = 0.052 (given) Inputting these values to calculate P(s, h, f | b) using the chain rule of probability, P(s, h, f | b) = 0.052 0.044 0.0976... = 2.2320577...10-4 = 2.2310-4 (3 sf) The police stop, search, and use force on about 2 in 10,000 of all Black drivers in a given year. Comparing these results to the general population, it is evidence that police are about twice as likely to use force on Black drivers following a stop and search than the general population.
P(s, h, f | w) = P(f | h, w) P(h | s, w) P(s | w) = 0.024 0.033 0.08606… = 6.8160920… 10-5 = 6.82 10-5 (3 sf) So police stop, search, and use force on 7 in 100,000 white drivers. To compare Black and white drivers, I found the ratio of P(s, h, f | b) to P(s, h, f | w): P(s, h, f | b)P(s, h, f | w)= 2.23… 10-46.816… 10-5 = 3.27 (3 sf) This ratio means that police are 3.27 times more likely to stop, search, and use force on Black drivers than white drivers. These findings reveal a relatively large disparity between the two races that may not have emerged without the use of Bayesian Networks. On its own, the BJS report provides data on standalone percentages of white and Black individuals who are stopped, searched after stops, and subject to force as shown in Table 2. When looking at that data, the discrepancies between these two races at each stage of a traffic stop do not appear significant. However, by building a chain of events in a Bayesian Network and applying the chain rule of probability, the individual probabilities of sequential stages can be combined to determine the joint probability of the final outcome: being stopped, searched, and subject to force. When observing this joining probability, a clear statistical discrepancy emerges: Black drivers are more than 3 times as likely as white drivers to be stopped, searched, and subject to force a traffic stop. Thus, The Bayesian Network approach is stronger than examining standalone percentages separately as it can relate linked events to reveal significant racial bias in a complete police-civilian encounter. Question 1b: Is the share of Black individuals among the drivers who police stop, search, and subject to force larger than their share in the driving population? Another useful indicator of racial bias is whether the share of Black drivers in all stop-search-force scenarios is comparable to their share in the total driving population. In other words, is the probability that someone who was stopped, searched, and subject to force is Black, or P(b | s, h, f), greater than P(b), the likelihood that any driver in the population is Black? If the probabilities differ, it shows that police stop, search, and use force on Black drivers at a disproportionate rate to their share in the driving population. While I did not explicitly calculate P(b | s, h, f), I can find it using other probabilities found when answering Question 1b. To do so, I will use Bayes Theorem, which calculates the probability that a hypothesis is true given certain evidence using the probability of observing that evidence if the hypothesis is true. Mathematically expressed, the formula for Bayes Theorem, where h = the hypothesis and e = the evidence, is: P(h | e) = P(e | h) P(h)P(e) With this theorem, P(b | s, h, f) can be defined as: P(b | s, h, f) = P(s, h, f | b) P(b)P(s, h, f) P(b) is the probability that a random driver is Black. It can be found by dividing the number of Black drivers by the total driving population (from Table 1) as follows: P(b) = 24,772,700223,315,400= 0.111… = 11.1% Using my previous calculations of P(s, h, f | b) and P(s, h, f) as well as P(b), P(b | s, h, f) = (2.232057709... 10-4) (24,772,700223,315,400) 1.05002586... 10-4 = 0.23580884… = 0.236 (3 sf) or 23.6% Black drivers make up only about 11.1% of the driving population. However, they account for 23.6% of all cases of people who are stopped, searched, and subject to force. This suggests that police subject Black drivers to force after a stop and search at a rate far higher than their share in the population. This disproportionate comparison reveals that there is racial bias at play during traffic stops, otherwise the two results would be closer to equal. Results: Question 1a determined that Black drivers are more than 3 times more likely to be stopped, searched, and subject to force than white drivers. Question 1b found that the share of Black drivers in stop-search-force scenarios is twice their share in the driving population. These findings show a large statistical discrepancy between white and Black drivers in traffic stops. They suggest that police treat drivers differently depending on their race, raising the need for training on diversity and fairness for traffic cops. While the media tends to focus on fatal police encounters, nonfatal police procedures, such as traffic stops, may also be influenced by racial discrimination. Given that such police-civilian encounters are common, racial bias in traffic stops plays a large role in the everyday lives of minority communities. Of course, these findings have some limitations. The BJS report provided data only to one decimal place, inhibiting their accuracy. Due to rounding happening early in data collection, it is impossible to calculate a final uncertainty or error with results. There was no explicit data on the use of force after a search, so I assumed that the likelihood of the use of force in a search would be equal to use of force in any police-civilian interaction. This could result in an overestimation in the police use of force in traffic stops. But importantly, these findings still suggest that non-fatal police-civilian encounters carry the potential for racial discrimination in places as public and commonplace as the highway. It is critical not only to address racial bias in fatal police shootings but also in the interactions Black citizens have with the police everyday to improve equality within our criminal justice system. Otherwise, racial bias may continue passing undetected, harming Black citizens everyday. Works Cited: “Bayesian Networks.” Donald Bren School of Information and Computer Sciences, University of California, Irvine, 2012. https://www.ics.uci.edu/~rickl/courses/cs-171/2012-wq-cs171/2012-wq-cs171-lecture-slides/2012wq171-17-BayesianNetworks.pdf. Accessed 14 Oct. 2020. United States, Department of Justice, Bureau of Justice Statistics, et al. Contacts Between Police and the Public, 2015, Bureau of Justice Statistics, Oct. 2018. www.bjs.gov/content/pub/pdf/cpp15.pdf. Accessed 20 Sept. 2020. The opinions and views expressed in this publication are the opinions of the designated authors and do not reflect the opinions or views of the Penn Undergraduate Law Journal, our staff, or our clients.
0 Comments
Your comment will be posted after it is approved.
Leave a Reply. |

|
|